Some examples
import numpy as np
import pandas as pd
import seaborn as sns
import matplotlib.pyplot as plt
%matplotlib inline
Creating a dummy Pandas dataframe
df = pd.DataFrame(np.random.randn(50,2))
How does the dataframe display render?
df.head()
| 0 | 1 | |
|---|---|---|
| 0 | -0.054716 | -0.316925 |
| 1 | 1.108315 | -0.940953 |
| 2 | -0.630501 | -1.307205 |
| 3 | 2.195365 | -0.142174 |
| 4 | 0.453562 | 0.406250 |
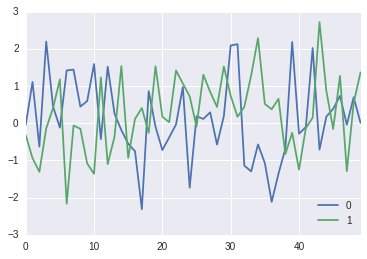
What about plots?
df.plot();
\[c = \sqrt{a^2 + b^2}\]
(c = in $$
from IPython.display import display, Math, Latex
display(Math(r'F(k) = \int_{-\infty}^{\infty} f(x) e^{2\pi i k} dx'))
\[F(k) = \int_{-\infty}^{\infty} f(x) e^{2\pi i k} dx\]